On this page
Note: This introduction follows Zitnick et al. (2020) for energy storage and idealized catalyst screening, then Tran et al. (2023) and Shuaibi et al. (2025) for oxides and solid–liquid interfaces. It connects the earlier posts on DFT and equivariant GNNs to catalyst discovery.
Introduction
The design problem is to find a catalyst1 material that achieves a target adsorption energy2 for a given chemical reaction.
The Sabatier principle says a catalyst must balance binding intermediates3 against releasing products. In a descriptor-based screening model, scaling relations can reduce several adsorption energies to one approximate coordinate. That coordinate helps predict activity within the model; it does not determine a real catalyst’s selectivity, stability, and operating performance on its own.
The search space is too large for exhaustive DFT. Catalyst surfaces are built from ~40 candidate metals in alloys of 1–3 elements, cut along different crystal facets,4 with multiple binding sites5 per surface. Combined with 82 relevant adsorbate6 molecules, the number of candidate configurations runs into the billions. The OC20 benchmark made this scale concrete for machine learning (Chanussot et al., 2021). Evaluating each one requires a DFT relaxation7 — an iterative quantum-mechanical simulation costing hours to days per candidate. Exhaustive evaluation is infeasible.
For ML, the problem is direct: learn a surrogate from material structure to adsorption energy, then search or generate candidates that hit the target. The rest of this post explains where the target comes from, why the search space has this structure, and why exhaustive search fails.
The Energy Storage Problem
Renewable electricity from solar and wind is intermittent. Solar output peaks at midday, while demand often peaks in the evening, creating the mismatch known as the duck curve.8 Storage is one way to address this mismatch, alongside transmission, demand response, and other sources of flexibility.

The 2020 comparison in Zitnick et al. illustrates the trade-offs below. Its efficiencies and cost estimates describe that study’s assumptions, not a current market assessment:
- Pumped-storage hydropower (PSH): the study reports 70–80% round-trip efficiency. Suitable elevations, reservoirs, and siting constrain deployment.
- Batteries: the study uses a broad 60–95% efficiency range. The economic comparison depends on battery technology, storage duration, utilization, and installation cost.
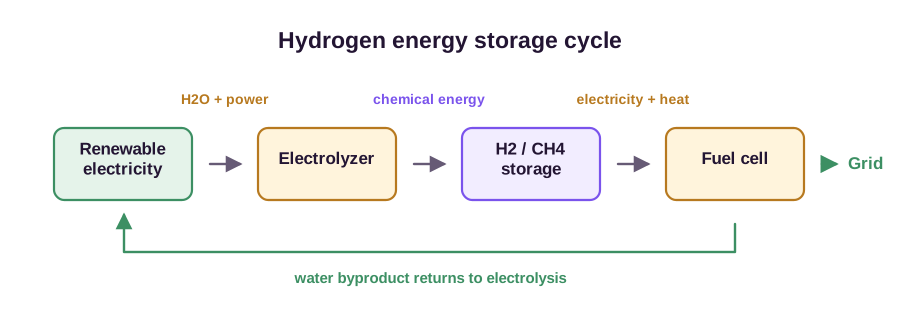
- Hydrogen energy storage (HES): Use excess electricity to split water (electrolysis),9 store the hydrogen, and convert it back to electricity in a fuel cell10 when needed. Round-trip efficiency is lower (~35%), but hydrogen can be stored in bulk at low cost — underground caverns, pressurized tanks, or converted to methane for existing natural gas infrastructure.
The efficiency gap is real: HES wastes roughly two-thirds of the input energy.11 But efficiency is not the only constraint. At grid scale, the relevant quantity is the total cost of stored energy. Zitnick et al. (2020) estimate HES at 113 USD/MWh, competitive with batteries for multi-day storage because cheap bulk hydrogen storage can offset the efficiency loss.
Catalysts are one important cost and efficiency constraint. Electrolyzers and fuel cells require electrocatalysts12 to drive reactions at practical rates, but the relevant materials differ by device and electrode. Platinum is important for PEM fuel cells and hydrogen electrodes; acidic oxygen evolution in PEM electrolyzers motivates the iridium-oxide discussion below. Storage infrastructure and balance-of-plant costs also matter.
Fuel Cells and Electrolyzers
The previous section identified catalysts as one constraint on hydrogen energy storage. The catalysis occurs inside two devices: the electrolyzer, which converts electricity into hydrogen, and the fuel cell, which converts hydrogen back into electricity. Their internal structure reveals the specific reactions a catalyst must accelerate, and why those reactions are hard.
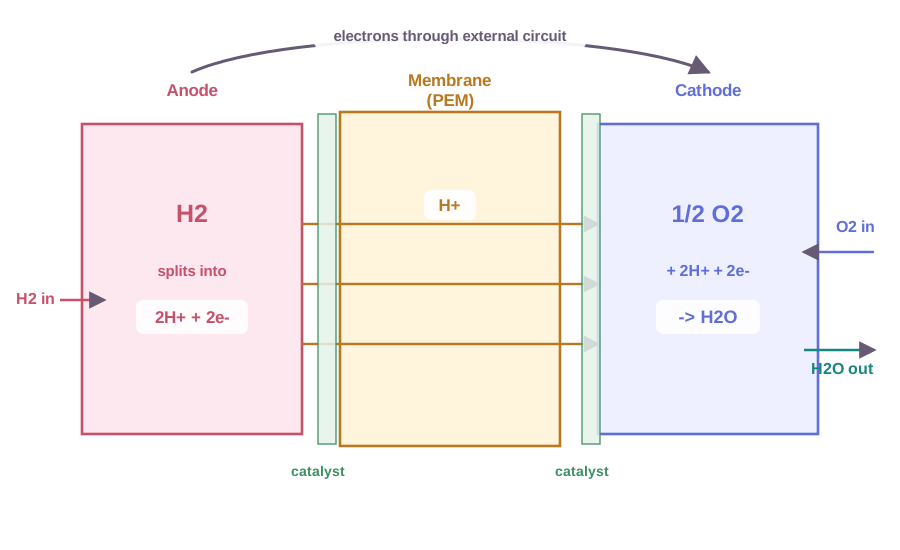
A proton exchange membrane (PEM) fuel cell converts hydrogen and oxygen into electricity and water. It has three layers:
- Anode:13 Hydrogen gas arrives and is split into protons and electrons: \(\text{H}_2 \rightarrow 2\text{H}^+ + 2e^-\).
- Membrane: A polymer electrolyte14 that conducts protons (H\(^+\)) but blocks electrons, forcing them through an external circuit — producing useful electrical current.
- Cathode: Oxygen combines with the protons and electrons to form water: \(\tfrac{1}{2}\text{O}_2 + 2\text{H}^+ + 2e^- \rightarrow \text{H}_2\text{O}\).
An electrolyzer runs the same reactions in reverse: apply a voltage to split water into hydrogen and oxygen. Both devices need a catalyst at each electrode15 to make the reactions proceed fast enough to be practical.
The Platinum Problem
The following numbers are historical motivation from the 2020 perspective, not present-day reserve or cost estimates.
Platinum is the best-known catalyst for both the hydrogen oxidation reaction at the anode and the oxygen reduction reaction16 at the cathode. It sits near the peak of the activity volcano, explained below: it binds reactants strongly enough to catalyze the reaction, but weakly enough to release products.
Cost and scarcity dominate:
- Platinum accounts for over 40% of fuel cell capital costs when including the support structures needed for adequate power density (Zitnick et al., 2020).
- To supply 35 TWh/day of electricity via HES would require ~2,000 metric tons of platinum. Known world reserves are ~70,000 metric tons.17
- A survey of automotive fuel cell experts found that 76% identified platinum cost as the primary barrier to reducing fuel cell costs.
Research suggests a 90% reduction in platinum loading may be achievable, and platinum-free catalysts are an active research area. Finding them requires searching a large materials space, where each candidate is expensive to evaluate.
Electrocatalysis
Heterogeneous catalysis18 involves a reaction between a solid surface, the catalyst, and gas- or liquid-phase reactants. The catalyst is not consumed; it provides a surface where reactants can adsorb,19 react, and desorb as products.

The Oxygen Reduction Reaction
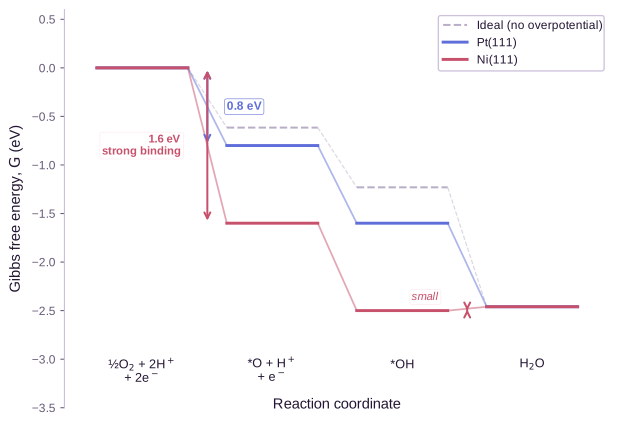
The cathode reaction in a fuel cell, the oxygen reduction reaction (ORR), is the harder half to catalyze and the primary target for improvement. Consider the dissociative pathway20 on a metal surface, where \(*\) denotes a binding site on the catalyst:
\[\tfrac{1}{2}\text{O}_2 + * \;\longrightarrow\; *\text{O}\] \[*\text{O} + \text{H}^+ + e^- \;\longrightarrow\; *\text{OH}\] \[*\text{OH} + \text{H}^+ + e^- \;\longrightarrow\; \text{H}_2\text{O} + *\]Each step involves an adsorbate (\(*\)O or \(*\)OH) bound to the catalyst surface. The reaction proceeds through these intermediate states, and the catalyst is regenerated at the end — the binding site \(*\) is freed.
Gibbs Free Energy and Reaction Barriers
Each step has a Gibbs free energy change \(\Delta G\), which determines whether the step is thermodynamically favorable (\(\Delta G < 0\)) or requires energy input (\(\Delta G > 0\)). Gibbs free energy is:
\[G = H - TS\]where \(H\) is enthalpy,21 \(T\) is temperature, and \(S\) is entropy.22
A catalyst works by lowering the activation energy23 barriers between steps — not by changing the overall thermodynamics (the total \(\Delta G\) from reactants to products is fixed), but by providing an alternative pathway with lower barriers.
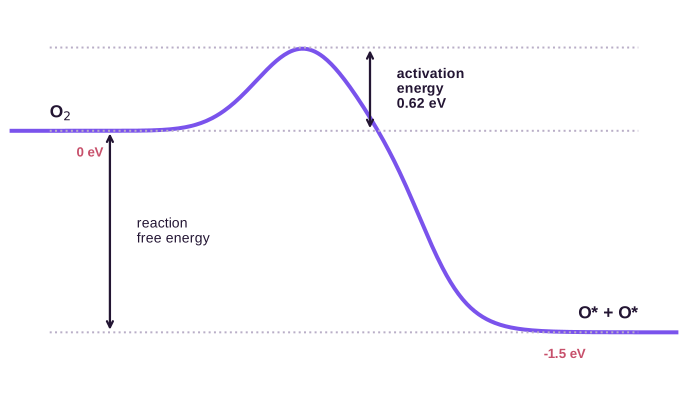
The key screening quantity is the adsorption energy: how strongly each intermediate binds to the surface. If binding is too strong, the intermediate cannot desorb and the catalyst is “poisoned.” If binding is too weak, the intermediate never forms.
The Sabatier Principle
The Sabatier principle. The optimal catalyst binds reaction intermediates neither too strongly nor too weakly. Too strong, and products cannot desorb. Too weak, and reactants cannot adsorb. Maximum activity occurs at an intermediate binding strength.
This qualitative principle becomes quantitative through the Brønsted-Evans-Polanyi (BEP) relations: across a family of catalysts, the activation energy \(E_a\) for a given elementary step is linearly related to the reaction energy \(\Delta E\):
\[E_a = \alpha \, \Delta E + \beta\]where \(\alpha\) and \(\beta\) are constants specific to the reaction step.24 The reaction rate follows the Arrhenius equation:25
\[r \propto \exp\!\left(-\frac{E_a}{k_B T}\right)\]Combining these: as adsorption energy becomes more negative (stronger binding), \(E_a\) decreases for adsorption steps but increases for desorption steps. The overall rate is limited by the slowest step. On the strong-binding side, desorption is rate-limiting — the rate decreases as binding strengthens. On the weak-binding side, adsorption is rate-limiting — the rate decreases as binding weakens. The result is a volcano plot: reaction rate versus adsorption energy traces an inverted-V shape, with the optimum at the peak.
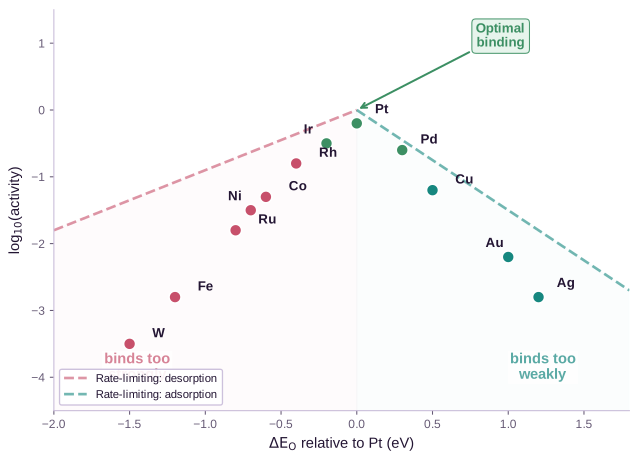
The volcano plot is the central organizing principle of electrocatalysis. The ORR version traces back to the overpotential analysis of Nørskov et al. (2004), and the broader computational-design program is laid out in Nørskov et al. (2009). It reduces catalyst discovery to a one-dimensional search: find a material whose adsorption energy places it at the volcano peak. Theory gives the optimal value; materials discovery asks which structure achieves it.
Scaling Relations and the Search Space
Why One Binding Energy Suffices
The ORR involves multiple intermediates (\(*\)O, \(*\)OH, \(*\)OOH), each with its own binding energy. In principle, optimizing the catalyst requires tuning all of them independently. In practice, they are correlated.
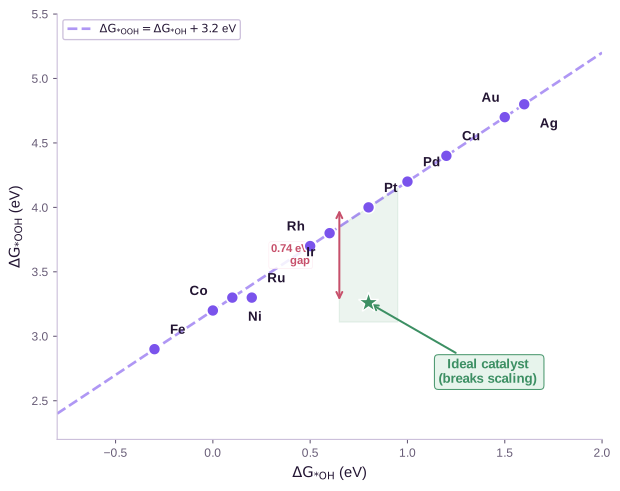
The \(*\)OH and \(*\)OOH binding energies often follow an approximate linear relation within families of related adsorption sites, with an offset near 3.2 eV:
\[\Delta G_{*\text{OOH}} \approx \Delta G_{*\text{OH}} + 3.2 \;\text{eV}\]This scaling relation arises because both \(*\)OH and \(*\)OOH bond to the surface through oxygen, so the catalyst surface “sees” similar binding chemistry. The hydrogen atoms point away and contribute little to the interaction.
The consequence is that a single descriptor, such as \(\Delta G_{*\text{OH}}\), approximately locates a catalyst on the descriptor-based volcano, within the assumed reaction mechanism. This makes screening tractable despite the high-dimensional space of possible materials.
The Constraint — and the Open Challenge
The scaling relation simplifies screening but also restricts the combinations of intermediate energies available within that site family. Designs with distinct binding sites or local environments can seek to change the relation. Whether that improves activity must be checked against the full mechanism, competing reactions, and stability; the empirical line is not a universal law.
The Design Space
Even with the simplification to a single descriptor, the space of candidate catalyst configurations is vast:
- ~40 metals can appear in a catalyst, in combinations of 1–3 elements (yielding over 10,000 compositions before considering ratios).
- Each composition can be cut along multiple crystal facets — (100), (110), (111), and others — exposing different surface arrangements.
- Each surface has multiple binding sites: an adsorbate can bond to 1 atom (atop), 2 atoms (bridge), or 3 atoms (hollow).
- 82 adsorbate molecules are relevant intermediates in renewable-energy reactions.


Combining these factors gives on the order of 1,000 candidate configurations per catalyst composition, and billions of total (composition, facet, site, adsorbate) combinations. Each evaluation requires a DFT relaxation, an \(O(n^3)\) iterative simulation that takes hours to days. This is the search problem that motivates ML approaches to catalyst design.
Why Oxides Matter
The previous sections focused on the fuel-cell cathode (ORR) and used pure metals, especially platinum, as running examples. The other half of the hydrogen energy cycle is water splitting, where the bottleneck is a different reaction: the oxygen evolution reaction (OER).26
\[2\text{H}_2\text{O} \;\longrightarrow\; \text{O}_2 + 4\text{H}^+ + 4e^-\]The OER is kinetically sluggish because it forms an O–O bond through four proton-coupled electron transfers, each with its own energy barrier. It is the primary source of efficiency loss in electrolyzers and the main target for catalyst improvement on the water-splitting side.
Metal oxides are the dominant catalyst class for the OER. The reason is stability: in PEM electrolyzers, water splitting operates under strongly acidic conditions with a proton-conducting membrane. Stability depends on both material and applied potential: many metals and oxides are unstable under these conditions. The best-known stable and active OER catalyst is iridium oxide (IrO\(_2\)) — but iridium is rarer and more expensive than platinum (Tran et al., 2023). Finding cheaper multi-component oxide catalysts that match IrO\(_2\) in both activity and acid stability is a central goal of electrocatalysis research.
Why Oxides Are Harder Than Metals
Oxide electrocatalysts make at least five issues especially important compared with the ideal unreconstructed pure-metal surfaces considered above (Tran et al., 2023):
- Multiple polymorphs. A given oxide composition (e.g., TiO\(_2\)) can crystallize in several distinct structures (rutile, anatase, brookite), each with different surface chemistry. All must be screened.
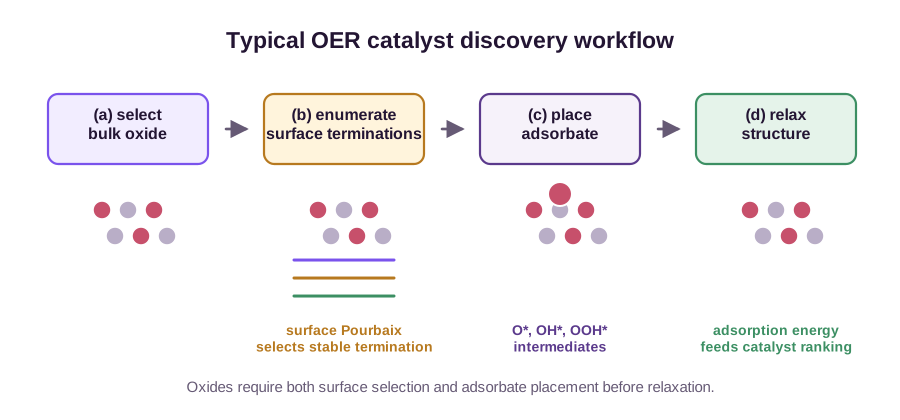
- Surface terminations. Cutting a crystal along a given plane can expose different atomic layers. A rutile (110) surface has at least three possible terminations,27 each presenting different atoms to the adsorbate. For an ideal unreconstructed elemental metal, the facet largely specifies the surface geometry; oxides also require a choice of chemical termination.
- Oxygen vacancies. Surface oxygen atoms can be removed — by thermal treatment, electrochemical reduction, or solvent dissolution — leaving behind vacancy defects that serve as active sites. The number and arrangement of vacancies affects both activity and selectivity.
- Active site ambiguity. It is often unclear which surface site is catalytically active, and multiple competing reaction mechanisms may operate simultaneously.
- Stronger electron correlation. Standard DFT functionals (GGA) are less accurate for oxides because of strong electron–electron interactions in transition metal d-orbitals. Hubbard U corrections28 or more expensive hybrid functionals are needed.

Adsorbate Binding on Oxides
On a metal surface, adsorbates bind to metal atoms at well-defined sites (atop, bridge, hollow). Oxides add a second class of binding interactions: adsorbates can bind to surface oxygen atoms rather than to metal atoms. This enables reactions that have no analogue on metals.
The Mars-van Krevelen (MvK) mechanism29 is the canonical example. In MvK, an incoming adsorbate reacts with a lattice oxygen atom on the surface, forming a new intermediate that desorbs and leaves behind an oxygen vacancy. The vacancy is later replenished by oxygen from the next adsorbate. The catalyst surface itself participates as a reactant, cycling between oxidized and reduced states.

Beyond Ideal Surfaces
The picture so far, with volcano plots, scaling relations, and well-defined crystal facets, applies to idealized single-crystal surfaces in vacuum. Real electrocatalysts operate under conditions that break these simplifications.
The Solid-Liquid Interface
Real electrocatalysis happens in liquid, not vacuum. The catalyst surface is immersed in an electrolyte, typically water with dissolved ions. This changes the physics in ways gas-phase models cannot capture (Shuaibi et al., 2025):
- Solvent stabilization. Water molecules form hydrogen bonds with adsorbed intermediates, shifting their binding energies. An intermediate that binds too weakly in vacuum may be stabilized enough by the solvent to become catalytically relevant.
- The electrical double layer. At an electrified interface, ions in the electrolyte rearrange to screen the surface charge, forming a structured layer whose properties govern charge transfer kinetics. The structure of this double layer depends on applied potential, ion concentration, and solvent identity.
- Specific ion adsorption. Ions from the electrolyte can adsorb directly on the catalyst surface, blocking active sites or modifying the local electronic environment.
The solvation energy captures these effects: it is the difference between a species’ adsorption energy in the solvated environment and in vacuum. A catalyst that looks optimal in gas-phase DFT may perform differently once solvent shifts binding energies by tenths of an eV, comparable to the width of the volcano peak.

Compositional Complexity
The design space expands beyond pure metals and binary alloys.
Heteroatom doping. Introducing foreign atoms — nitrogen, sulfur, phosphorus, boron — into a host material modifies the electronic structure of nearby active sites. Nitrogen-doped carbon catalysts are a well-known example. Dopant concentration, spatial distribution, and the specific coordination environment all affect activity. Even for a single host material, this creates a large combinatorial space.
High-entropy materials. These contain five or more principal elements in near-equimolar ratios, as in high-entropy alloys (HEAs) or high-entropy oxides. The vast configurational space produces local electronic environments not achievable in simpler compositions. Properties emerge from collective interactions among elements (the “cocktail effect”), not from individual elemental contributions. This makes decomposition-based reasoning, such as “element A contributes property X,” unreliable.
Structural Disorder and Dynamic Surfaces
Many high-performing electrocatalysts lack long-range crystalline order. Amorphous metal oxides and hydroxides used for oxygen evolution have no single repeating unit cell. Instead, they present a distribution of local coordination environments, each with potentially different catalytic activity. Standard DFT assumes periodic boundary conditions and a well-defined slab; modeling amorphous surfaces requires large supercells or ensemble sampling to capture this structural diversity.
Surface reconstruction under operating conditions compounds the difficulty. Atoms migrate, oxidation states change, and the electrochemically active phase may differ from the as-synthesized material. Oxide surfaces are particularly prone to reconstruction: partial dissolution by the solvent creates vacancy defects, and applied potential can rearrange the surface. The structure being modeled is not necessarily the structure that catalyzes.
Oxides also exhibit magnetic polymorphism: the same crystal structure can have different magnetic configurations (ferromagnetic, antiferromagnetic, nonmagnetic), each with different surface energies and adsorption properties (Tran et al., 2023).
In semiconducting oxides, charge self-compensation adds another failure mode. When vacancies or dopants perturb the electron count, the surface can thermodynamically prefer to reconstruct — breaking or forming bonds — rather than promote electrons into the conduction band. A vacancy on one side of a slab can trigger geometric rearrangement on the other side, an effect that is long-ranged and difficult to capture with local models.
Scaling Relations on Complex Materials
The linear scaling relations that simplify catalyst screening on metals (the \(\Delta G_{*\text{OOH}} \approx \Delta G_{*\text{OH}} + 3.2 \;\text{eV}\) relation from the Scaling Relations section) were established on close-packed metal surfaces with uniform binding sites. On oxide surfaces with diverse site types, the picture is noisier.

Tran et al. (2023) find that adsorption-energy correlations persist in OC22, but with substantial scatter: the plotted OOH–OH relation has \(R^2\) near 0.6. Two oxides with similar \(\Delta G_{*\text{OH}}\) can therefore have meaningfully different \(\Delta G_{*\text{OOH}}\). A single descriptor is a useful approximation to test, not a substitute for checking the other intermediates.
When scaling relations break down, the full multidimensional binding-energy space re-emerges. Each intermediate must be evaluated independently, and the tractable one-dimensional search becomes a high-dimensional optimization problem: a setting where surrogates may reduce the number of expensive calculations, provided their errors are controlled.
Machine Learning for Catalyst Discovery
The search problem is now clear: find a catalyst whose adsorption energy sits near the useful part of the volcano, inside a huge space, when each DFT relaxation can take hours or days. Machine-learning interatomic potentials (MLIPs)30 replace many DFT evaluations with fast energy-and-force predictions, and screening workflows such as AdsorbML (Lan et al., 2023) relax many candidate placements before validating only a small top-\(k\) set with DFT.
Generation tries to skip part of enumerate-then-filter, but a catalyst is not a free molecule. The slab, surface orientation, adsorbate, and binding pose are coupled; changing one part can change the rest. In our group, CatFlow (Kim et al., 2026) targets this joint-generation problem. The hard part remains the surface-adsorbate coupling described above.
Open Challenges
Several gaps remain between current ML capabilities and practical catalyst discovery:
- Out-of-distribution generalization. Models trained on OC20 (metals) transfer imperfectly to oxides (OC22) or solvated interfaces (OC25). Fine-tuning helps, but the chemical diversity of real catalyst spaces — high-entropy alloys, amorphous oxides, doped carbons — remains undersampled.
- Long-range interactions. Local message-passing GNNs struggle with the long-range electrostatics and magnetic interactions that dominate in semiconducting oxides (see Beyond Ideal Surfaces). Extending effective interaction ranges without prohibitive cost is an active research direction.
- Beyond adsorption energy. Current screening pipelines optimize a single thermodynamic descriptor. Real catalyst selection requires stability under operating conditions (Pourbaix analysis), synthesis feasibility, cost, and selectivity — none of which are captured by adsorption energy alone.
References
- Zitnick, C. L., Chanussot, L., Das, A., Goyal, S., Heras-Domingo, J., Ho, C., … & Ulissi, Z. W. (2020). An introduction to electrocatalyst design using machine learning for renewable energy storage. arXiv:2010.09435. ↩
- Chanussot, L., Das, A., Goyal, S., Lavril, T., Shuaibi, M., Riviere, M., … & Zitnick, C. L. (2021). Open Catalyst 2020 (OC20) dataset and community challenges. ACS Catalysis, 11(10), 6059-6072. DOI. ↩
- Nørskov, J. K., Rossmeisl, J., Logadottir, A., Lindqvist, L., Kitchin, J. R., Bligaard, T. & Jónsson, H. (2004). Origin of the overpotential for oxygen reduction at a fuel-cell cathode. J. Phys. Chem. B, 108(46), 17886-17892. DOI. ↩
- Nørskov, J. K., Bligaard, T., Rossmeisl, J. & Christensen, C. H. (2009). Towards the computational design of solid catalysts. Nature Chemistry, 1, 37-46. DOI. ↩
- Tran, R., Lan, J., Shuaibi, M., Wood, B. M., Goyal, S., Das, A., … & Zitnick, C. L. (2023). The Open Catalyst 2022 (OC22) dataset and challenges for oxide electrocatalysts. ACS Catalysis, 13(5), 3066-3084. DOI. ↩
- Shuaibi, M., Choubisa, H., Engel, M., Wood, B. M., Musielewicz, J., Comer, B., … & Zitnick, C. L. (2025). Open Catalyst 2025 (OC25): dataset and models for the solid-liquid interface. arXiv:2509.17862. ↩
- Lan, J., Palizhati, A., Shuaibi, M., Wood, B. M., Wander, B., Das, A., … & Zitnick, C. L. (2023). AdsorbML: a leap in efficiency for adsorption energy calculations using generalizable machine learning potentials. npj Computational Materials, 9, 172. DOI. ↩
- Kim, M., Kim, N., Kim, H. & Ahn, S. (2026). CatFlow: co-generation of slab-adsorbate systems via flow matching. arXiv:2602.05372. ↩
-
A catalyst is a substance that increases the rate of a chemical reaction without being consumed. It works by lowering the energy barrier (activation energy) that reactants must overcome, providing an alternative reaction pathway. The catalyst participates in intermediate steps but is regenerated at the end. ↩
-
The adsorption energy (or binding energy) measures how strongly a molecule sticks to a surface. More negative values mean stronger binding. It is computed as the energy difference between the combined system (molecule on surface) and the separated components (clean surface + isolated molecule). ↩
-
A reaction intermediate is a molecule that is produced in one step of a multi-step reaction and consumed in a subsequent step. It exists transiently on the catalyst surface. For the oxygen reduction reaction, the intermediates are \(*\)O and \(*\)OH, where \(*\) denotes binding to the surface. ↩
-
A crystal facet is the flat surface exposed when a crystal is cut along a specific plane. Different cuts expose different arrangements of atoms. Facets are labeled by Miller indices — e.g., (111), (110), (100) — which describe the orientation of the cutting plane relative to the crystal lattice. ↩
-
A binding site is a specific location on the catalyst surface where an adsorbate molecule can attach. On a close-packed metal surface, common sites include: atop (directly above one atom), bridge (between two atoms), and hollow (in the center of three atoms). Each site type produces a different adsorption energy. ↩
-
An adsorbate is a molecule or atom that has adhered to a surface. In electrocatalysis, adsorbates are the reaction intermediates sitting on the catalyst surface — for example, an oxygen atom (\(*\)O) or a hydroxyl group (\(*\)OH) bonded to a metal surface. ↩
-
A DFT relaxation (or geometry optimization) is an iterative simulation that finds the lowest-energy arrangement of atoms. Starting from an initial guess, each step computes quantum-mechanical forces on every atom using density functional theory (see previous post), then nudges the atoms downhill. This repeats for 50–400 steps until the forces converge to near zero. ↩
-
The “duck curve” refers to the shape of net electricity demand (demand minus solar generation) over a day: it dips at midday when solar peaks, then rises sharply in the evening. First identified by the California Independent System Operator (CAISO). ↩
-
Electrolysis is the process of using electrical energy to drive a non-spontaneous chemical reaction. In water electrolysis, an applied voltage splits water into hydrogen and oxygen: \(2\text{H}_2\text{O} \rightarrow 2\text{H}_2 + \text{O}_2\). ↩
-
A fuel cell is an electrochemical device that converts chemical energy (from a fuel like hydrogen) directly into electrical energy, without combustion. Unlike a battery, it does not store energy internally — it produces electricity continuously as long as fuel is supplied. ↩
-
Zitnick et al. (2020) estimate HES round-trip efficiency at ~35% (AC to AC), compared to 70–80% for pumped hydro and 60–95% for batteries. The losses occur in both the electrolyzer (~70% efficient) and the fuel cell (~60% efficient): 0.7 × 0.6 ≈ 0.42, minus additional transmission and conversion losses. ↩
-
An electrocatalyst is a catalyst that operates at an electrode surface in an electrochemical cell. It accelerates reactions involving electron transfer — such as the splitting of water or the reduction of oxygen. The “electro-“ prefix distinguishes it from catalysts for purely thermal or gas-phase reactions. ↩
-
The anode is the electrode where oxidation occurs (loss of electrons); the cathode is where reduction occurs (gain of electrons). A mnemonic: anode = away (electrons flow away from it). ↩
-
An electrolyte is a substance that conducts ions but not electrons. In a PEM fuel cell, the polymer membrane serves as the electrolyte — it allows protons (H\(^+\)) to pass through while forcing electrons to travel through the external circuit. ↩
-
An electrode is a conductor through which electric current enters or leaves an electrochemical cell. In a fuel cell, the two electrodes are the anode (fuel side) and cathode (oxygen side). ↩
-
The oxygen reduction reaction (ORR) is the cathode half-reaction in a fuel cell: \(\text{O}_2 + 4\text{H}^+ + 4e^- \rightarrow 2\text{H}_2\text{O}\). It is kinetically sluggish — the main source of efficiency loss in fuel cells — and the primary motivation for catalyst research. ↩
-
As of 2020. South Africa holds approximately 80% of known platinum reserves. ↩
-
Heterogeneous catalysis means the catalyst and reactants are in different phases — typically a solid catalyst with gas- or liquid-phase reactants. This is in contrast to homogeneous catalysis, where catalyst and reactants are in the same phase (e.g., both dissolved in solution). ↩
-
Adsorption is the adhesion of atoms or molecules to a surface (not to be confused with absorption, which is uptake into the bulk). In chemisorption, the adsorbate forms a chemical bond with the surface. In physisorption, the interaction is weaker (van der Waals forces only). ↩
-
In a dissociative pathway, a molecule breaks apart as it adsorbs — e.g., O\(_2\) splits into two separate O atoms on the surface. The alternative is an associative pathway, where the molecule adsorbs intact and breaks apart in a later step. ↩
-
Enthalpy (\(H\)) is the total heat content of a system at constant pressure: \(H = U + PV\), where \(U\) is internal energy, \(P\) is pressure, and \(V\) is volume. Changes in enthalpy (\(\Delta H\)) measure the heat released or absorbed by a reaction. ↩
-
The Gibbs free energy (\(G = H - TS\)) determines the direction of spontaneous processes at constant temperature and pressure. A reaction with \(\Delta G < 0\) is thermodynamically favorable (exergonic); \(\Delta G > 0\) requires energy input (endergonic). ↩
-
The activation energy (\(E_a\)) is the minimum energy that reactants must have to undergo a reaction. Even thermodynamically favorable reactions (\(\Delta G < 0\)) may proceed slowly if the activation energy is high. A catalyst provides an alternative pathway with a lower \(E_a\). ↩
-
The BEP relation is an empirical observation: across a family of related catalysts, activation energy is linearly related to reaction energy. Proposed independently by Brønsted (1928) and Evans & Polanyi (1938). The slope \(\alpha\) is typically between 0 and 1. ↩
-
The Arrhenius equation says that reaction rate increases exponentially as the activation energy decreases or temperature increases. \(k_B\) is Boltzmann’s constant. At room temperature (\(k_B T \approx 0.025\) eV), even small changes in \(E_a\) (tenths of an eV) cause large changes in rate. ↩
-
The oxygen evolution reaction (OER) is the anode half-reaction in water splitting: \(2\text{H}_2\text{O} \rightarrow \text{O}_2 + 4\text{H}^+ + 4e^-\). It is the reverse of the ORR and is kinetically even more demanding — forming the O–O bond requires coordinating four electron transfers. ↩
-
A surface termination is the specific atomic layer exposed when a crystal is cut. On a binary oxide like TiO\(_2\), cutting along the (110) plane can expose a Ti-rich, O-rich, or mixed layer depending on where the cut is made. Each termination has different catalytic properties. ↩
-
The Hubbard U correction adds an empirical on-site Coulomb repulsion to specific orbitals (usually transition metal d-orbitals) to compensate for the tendency of standard DFT functionals to over-delocalize electrons. Typical U values range from 3–6 eV depending on the metal. ↩
-
The Mars-van Krevelen (MvK) mechanism is a catalytic cycle in which lattice atoms from the catalyst surface participate directly in the reaction. An adsorbate reacts with a surface oxygen, the product desorbs (creating a vacancy), and the vacancy is replenished by oxygen from a subsequent reactant. Common in oxide and carbide catalysts. ↩
-
A machine learning interatomic potential (MLIP) is a model that predicts the potential energy surface of an atomic system — total energy as a function of atomic positions — learned from quantum-mechanical (typically DFT) training data. Once trained, it can compute energies and forces orders of magnitude faster than DFT, enabling rapid structure relaxation and molecular dynamics. ↩